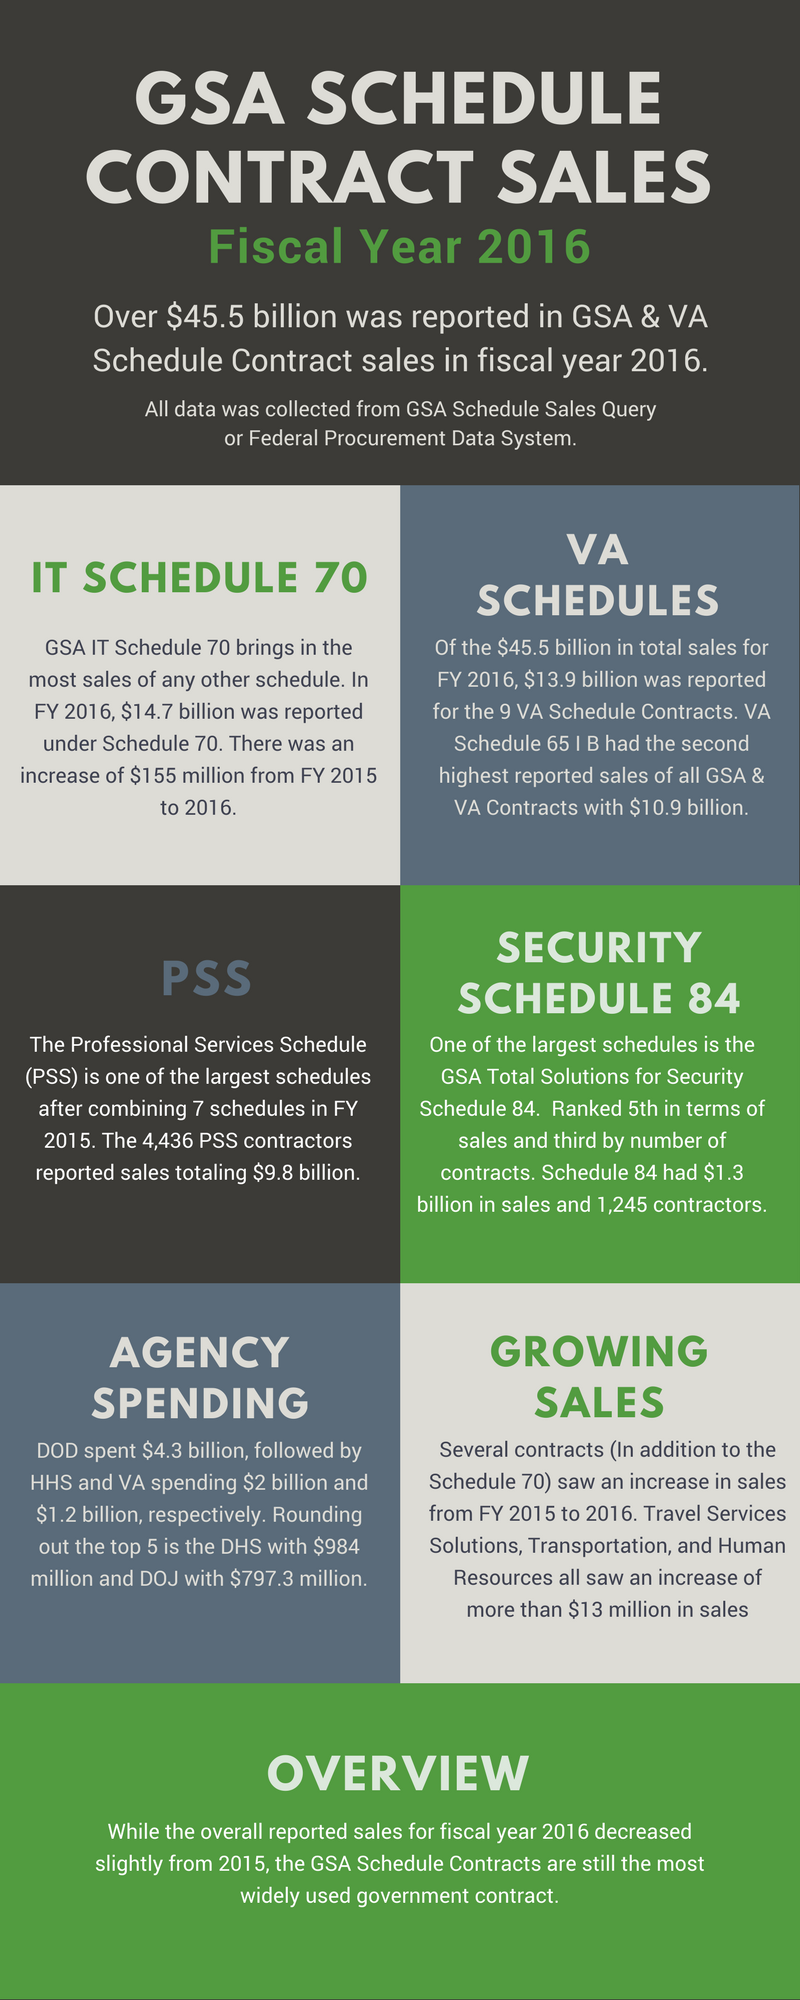
The General Services Administration (GSA) recently released fiscal year 2016 sales. With $45.5 Billion in sales, GSA & VA Schedules remain the most widely used government contracts. Around 18,300 companies held a GSA or VA Schedule Contract in fiscal year 2016, making average sales per contractor $2.9 million.
GSA Schedules with Sales Increase
Despite a decline in total sales from fiscal year 2015, several GSA Schedule Contracts reported higher sales in fiscal year 2016. The GSA IT Schedule 70 Contract saw the greatest growth.
Highest Sales Increase From FY 2015
- GSA IT Schedule 70 | $155 M ↑
- GSA Travel Services Solutions Schedule 599 | $55 M ↑
- VA Patient Mobility Devices | $28 M ↑
- Transportation, Delivery & Relocation Services Schedule 48 | $17 M ↑
- Human Resources Schedule 738 X | $15 M ↑
- Medical Lab Testing | $14 M ↑
- Automotive Superstore Schedule 23 V | $13 M ↑
GSA Schedules with Highest Sales
The top 5 GSA Schedules in fiscal year 2016 all boast sales in the billions. Schedules 70 and 65 I B reported over $10 billion in sales, while Professional Services Schedule (PSS) was just under that threshold with $9.8 billion.
Highest Sales in FY 2016
- GSA IT Schedule 70 | $15 B
- VA Pharmaceuticals and Drugs Schedule 65 I B | $11 B
- GSA Professional Services Schedule (PSS) 00CORP | $9.8 B
- VA Medical Equipment and Supplies Schedule 65 II A | $1.7 B
- GSA Total Solutions for Security Schedule 84 | $1.2 B
Source: GSA Schedule Sales Query & FPDS
For More Information & Detailed GSA Sales Report
If your company is considering obtaining a GSA Schedule Contract and would like more information on the proposal process or a sales report for a specific GSA Schedule, contact us.


